The title of this article has the potential to frighten off a few people; but please don't be frightened. The idea that anything mathematical is “too difficult” pervades our culture, but the basic ideas are not at all difficult. I won't be asking you to do any calculations, because I'm more interested in looking at some philosophical issues. Only the homework is difficult.
Even so, you might well ask why I am writing on such a dry topic. Part of the answer is that the topic is not quite as dry as it may seem to be. The more important part is that this is background for other articles I am hoping to write. Modern physics, or more specifically quantum physics, tells us that we are living in a probabilistic universe, where the macroscopic phenomena we observe are the outcome of a fundamental reality which is random rather than deterministic. This is a very different picture of reality than classical physics provided, and is counterintuitive to many people. If we want to explore such issues, then we had better start with a proper understanding of what “probability” really means.
Probability theory got its start, not surprisingly, when some mathematicians tried to solve problems related to gambling. By now it has gone well beyond that. If you consult a text on the subject you'll find mention of things like measure spaces, sigma-algebras, and suchlike; topics that do take a bit of work to understand. I'm going to avoid those complications, and stick to the easy cases.
Let's consider an experiment with a finite number of distinct outcomes, and let X denote one of those outcomes. The probability that X will happen, which I'll write as Pr(X), is a number between 0 and 1, and it's a measure of how certain we are that X will happen. A value of 0 means that we don't expect it to happen at all. At the other extreme, a value of 1 means that we're certain that it will happen. The actual number will be somewhere between these extremes.
If we consider the probability of every possible outcome, and add these numbers, the answer should turn out to be exactly 1. Any other answer would indicate that we'd made a mistake, perhaps in the addition, or in the initial assignment of probabilities; or it might mean that there were some possible outcomes that we forgot about.
The intuitive meaning of the probability is that Pr(X) should predict the fraction of the time that X will occur, in the long run, if the experiment were repeated over and over again. That “in the long run” is an important qualification. It can easily happen that X occurs three times in a row, but we can't conclude from that that Pr(X) is large. It takes many repetitions of the experiment before the numbers settle down.
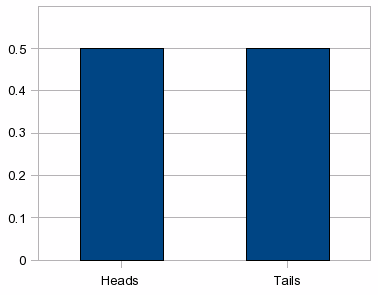
The simplest example is the tossing of a fair coin. There are just two outcomes: heads or tails. (The probability of the coin standing on its edge is so small that we can afford to neglect that case.) Since either case is equally likely, and since the two probabilities must add up to 1, the probability of heads must be 0.5. Similarly, the probability of tails must be 0.5.
Let's examine that glib statement a little more closely. It sounds correct, but can you be certain that I'm not bamboozling you with some fast talking? How can we be confident that the answer is correct?
I can think of three ways of arguing that the statement is correct:
the argument by definition;
the argument by experiment;
arguments that appeal to pure reason.
These all have their advantages and their faults. Let's look at them one at a time.
The simplest way around the problem is to define a fair coin as one that will give equal probability of heads and tails. (This distinguishes it from an unfair coin, which is internally weighted so as to favour one side.) Presto! The problem is solved.
Although the notion of a fair coin is appealing, we don't (yet) have enough evidence that real-world coins behave like the hypothetical fair coin. At heart, this argument is about an abstraction. It's a circular argument unless we can find a way to relate it to the real world.
The very essence of the scientific method is to say “Forget about the abstractions. Let's try it, and see what happens.” Experiment, experiment, experiment. Toss the coin many times, and see how often heads come up.
Well, people have tried this, and it seems to work. Toss a coin a thousand times, and approximately (but not precisely) half the time you will get heads. This strongly suggests that Pr(heads) is so close to 0.5 as makes no difference. We presume that if we continued the experiment the answer would get closer and closer to 0.5.
Can we be really certain, though? Perhaps there is some – as yet undiscovered – law of nature that says that the coin's behaviour will abruptly change after the millionth toss. Continuing the experiment for a million tosses doesn't resolve this problem. Perhaps we were wrong, and this new behaviour doesn't start until the billionth toss. No matter how long you continue, you can't be certain that there isn't a surprise just around the corner.
Philosophically, we are inclined to believe in a “no hidden surprises” model of the universe. If the coin behaves as expected for the first few hundred tosses, then most of us would decide that it would continue to behave that way forever. That's an article of faith, and I'll return to it later.
Among the possible “pure reason” arguments, the most appealing in the present case is one that appeals to symmetry. A real-life coin is not perfectly symmetrical – it it were, there would be no way to tell heads from tails – but if it's not a biased coin then it's reasonable to presume that any departure from symmetry is so small as to have an insignificant effect on the outcome. For our present purposes, we can suppose that the “heads” side is no different in essence from the “tails” side. With neither side being privileged over the other, we deduce that the two outcomes have equal probability.
“Pure reason” arguments are always a little bit suspect, because a connection to the real world has not been shown. If, however, we take the pure reason argument in conjunction with the experimental results, we have a moderately compelling case.
Such arguments have been possible only in the last few hundred years. A thousand years ago, people believed that the world was chaotic and unpredictable. Magic was taken seriously; and magic is, at root, all about being able to violate the normal laws of nature in arbitrary ways. Given such a belief system, arguments such as the one that a coin has no preferred side were not as compelling, because frivolous nature could change the rules in mid-toss.
An early challenge to this worldview was Occam's Razor. William of Ockham, a 14th-century logician, proposed that if there were several ways of explaining some phenomenon then the simplest explanation was most likely to be correct. The underlying assumption here is that nature is fundamentally uncomplicated. The universe, we now believe, is not out to trick and confuse us.
Physicists, those most austere of scientists, have a strong belief in the simplicity of nature. If a theory is complicated, they believe, then there must be something wrong with the theory. Some go further, believing that any theory that lacks elegance and beauty is flawed.
Can we really use aesthetic judgements to judge the validity of a proposed law of nature? The idea is not as far-fetched as it might sound. Our aesthetic standards are set by the sort of world we grew up in. Beauty is often seen in terms of conformity with natural simplicity. If we had evolved in a different universe, with different physical laws, we would almost certainly have different notions about beauty. Thus, it is not too hard to believe that any valid description of how the universe work must automatically comply with our aesthetic standards.
Even religious people are moving towards this point of view. Statements like “God is a mathematician” or “God is a physicist” are no longer treated with derision. If an omnipotent god is responsible for the laws of physics, then he would hardly flaw his design by deliberately violating those laws. A hypothetical chaotic and unpredictable universe is now seen as something approaching the diabolical. Miracles – departures from natural law – are seen by many as cheap stage magicians' tricks, unworthy of a self-respecting god.
Still, we mustn't forget that we can never prove that the universe is well-behaved. We believe that it is, because that's what the evidence so far has shown, but it's not a fact established beyond doubt.
For rolling a six-sided die, essentially the same arguments apply. No side is more “special” than any other, so all six outcomes must be equally probable. That is, the probability of rolling a 1 is 1/6; the probability of rolling a 2 is also 1/6; and so on.
So far we have looked only at situations where the outcomes are equally probable. Can we find situations where the probabilities are unequal, but we can still use simple reasoning to calculate those probabilities?
Here's one such example. Lets us roll two fair dice. What is the probability of getting a total of N, where N is a number between 2 and 12? (Note that N=1 is impossible.)
There are six possible outcomes for the first die, and six possible outcomes for the second die, so there are 36 possible outcomes in total. It should be clear, from our previous reasoning, that each of those 36 cases has a probability of 1/36 of occurring. However, there are only 11 possible values of the sum of the two numbers. How can this be?
It happens because some totals can be rolled in several different ways. There is only one way to roll a 12 (6+6), but there are four ways of rolling a 5 (1+4, 2+3, 3+2, 4+1). That means that a 5 is four times as probable as a 12.
It is a simply matter to work out how many different combinations are possible for each case. That means we can tabulate the probabilities, as below.
|
N |
ways to get N |
let me count the ways |
Pr(N) |
|---|---|---|---|
|
1 |
- |
0 |
0 |
|
2 |
1+1 |
1 |
1/36 = 0.03 |
|
3 |
1+2,2+1 |
2 |
2/36 = 0.06 |
|
4 |
1+3,2+2,3+1 |
3 |
3/36 = 0.08 |
|
5 |
1+4,2+3,3+2,4+1 |
4 |
4/36 = 0.11 |
|
6 |
1+5,2+4,3+3,4+2,5+1 |
5 |
5/36 = 0.14 |
|
7 |
1+6,2+5,3+4,4+3,5+2,6+1 |
6 |
6/36 = 0.17 |
|
8 |
2+6,3+5,4+4,5+3,6+2 |
5 |
5/36 = 0.14 |
|
9 |
3+6,4+5,5+4,6+3 |
4 |
4/36 = 0.11 |
|
10 |
4+6,5+5,6+4 |
3 |
3/36 = 0.08 |
|
11 |
5+6,6+5 |
2 |
2/36 = 0.06 |
|
12 |
6+6 |
1 |
1/36 = 0.03 |
|
Totals |
|
36 |
1.01 |
The totals are a check that we haven't made a mistake. The number of ways should add up to 36, and the probabilities should add up to 1.00. The reason we didn't get precisely 1.00 is that the numbers are rounded to two decimal places. If we had rounded to, say, four decimal places, then the total would have been closer to 1. Giving the answers to four decimal places would, on the other hand, imply a precision that isn't really justified. If you roll the dice a few times, and keep track of the results, those results won't be precisely the same as shown in the table. They would approach those values after enough rolls, but you would have to repeat the experiment many times before the distortions caused by freak runs became very small.
If you search hard enough, you will find many examples where probabilities can be calculated by tabulating every possible outcome, as was done in this example.
The coin-tossing and dice-throwing examples are, of course, toy examples that happen to be simple enough to discuss. In practice we often hear of probability estimates that were unlikely to have been derived from first principles. “New diet gives 12% lower risk of heart disease.” “Nine out of ten dentists recommend our brand of toothpaste.” To what extent can we trust these figures?
To begin with, we have to struggle our way through the misreporting and ambiguous statements. Twelve per cent lower than what? How many dentists were included in the study, and how many of these were given free samples? Did they live in a country where one toothpaste company has a virtual monopoly?
All too often, unfortunately, further exploration will show that the figures are falsified, based on poorly-conducted studies, or presented in a misleading way. This is not always the result of a deliberate attempt to mislead. Sometimes it's just sloppy reporting. How, for example, would you understand a newspaper headline that said “Interest rates to rise by 1%”? All too few people understand that a rate rise from 8% p.a. to 9% p.a. is actually a 12.5% rise. (1% p.a. is one-eighth of 8% p.a.) Then they get upset when they discover that their mortgage repayments have risen by very much more than 1%.
Once the rubbish is sifted out, a few genuine results remain. Those results are typically in a category that has nothing to do with using symmetry or similar arguments to get an answer from principles. Where did the numbers come from, then?
In almost all cases, they come from experimental studies. If it's, say, a question of the efficacy of some new drug, a sample population is studied. Some of the people are given the new drug, and some are not. Outcomes are assessed for both groups, and from this a success rate is calculated for the treatment. If the population studied is large enough, then the probabilities estimated by experiment will be close to the true underlying probabilities.
This approach is valid, with one proviso. If the experimenters got their statistical education in disciplines like sociology, psychology, or medicine, then it is highly likely that the results are not statistically significant. That is, it is highly likely that apparently favourable outcomes actually arose by pure chance, rather than being a consequence of the phenomenon being studied. Because of the empire-building and interdisciplinary struggles – most particularly, the struggle to get an adequate portion of an inadequate total budget – that are common in universities, it is rare for students in those disciplines to be taught statistics by statisticians. The statistics courses are, in the cases I've seen, taught by non-experts, and errors and misconceptions are passed down from generation to generation. Students are not properly taught concepts like statistical significance and confidence measures. Most importantly, they are not taught that experimental studies conducted with too small a sample size will give meaningless results.
This phenomenon is not (yet!) a big problem in engineering and the “hard” sciences. For whatever reason, those disciplines have retained the tradition that subjects should be taught by specialists in the subject area, even when those specialists come from outside one's own department, school, or faculty.
Unfortunately, we're often not in a position of being able to assess the validity of a study whose results we are being told, especially when that study is in an area that lies well outside our own area of expertise. The best we can do is to retain a healthy scepticism.
Recall that, for an experiment with a finite number of possible outcomes, Pr(X) denotes the probability that outcome X occurs. In many cases that “X” can be characterised by a number. In the two-dice-throwing experiment, for example, the possible outcomes can be lumped into twelve possible cases, because the total of the two dice can be a number from zero up to twelve. (In fact, the totals 0 and 1 are impossible with two dice, but we can deal with that by assigning a zero probability to those outcomes.) That means that we can picture the probabilities by drawing a graph.
The
graph for tossing a single coin is rather unexciting. We have only
two possible outcomes, giving the following graph of the
probabilities:
This is not a very exciting graph. For the case of
throwing two dice, the result is more interesting:
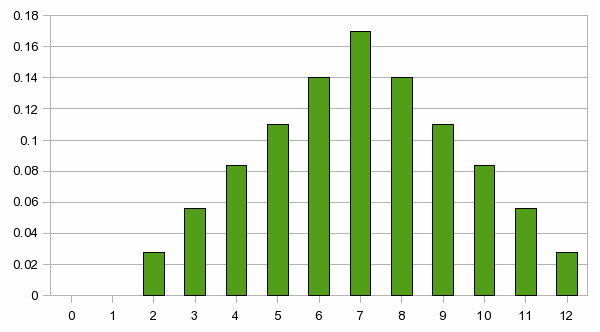
The
beauty of presenting probabilities in this way is that we get an
intuitively clear idea of how the probability varies with the number
that expresses the outcome. In the two-dice case, for example, it is
immediately clear that we should bet on a 7 if all other things are
equal; and we can see the relative likelihood of outcomes other than
7.
This graph is one example of what we call a “distribution”. This term simply means the process of assigning a number – in this case, a probability – to an outcome. The result doesn't have to be expressed as a graph. Mathematicians usually prefer to have a mathematical formula that describes the distribution. For most people, however, a graph has more intuitive significance.
This section is a bit more technical, and you can skip it if you are scared of mathematics. I urge you, however, to make at least some attempt to understand it, because the Poisson distribution is one of the most fundamental of all probability distributions. It gets its name from a person who was one of the pioneers of probability theory, in addition to his many other contributions to mathematics.
(At this point I can't resist adding that Siméon Poisson (1781-1840) was my PhD advisor ten times removed. If you don't believe this, take a look at the Mathematics Genealogy Project. To be fair, I should also mention my belief that modern Western society can probably trace its intellectual heritage back to a small handful of people.)
An example of where the Poisson distribution is used is where we are designing a telephone exchange, and we want to know how to design the capacity of the exchange, given the likely number of simultaneous calls expected in that region. One of the numbers that must be used in such a calculation is the “arrival rate”, which is the rate at which new calls commence. An arrival rate of 3.8 per minute (to pluck a figure out of the air) would mean that in the long run we would expect an average of 3.8 new calls to commence each minute. An important assumption here is that we assume that the probability of a new call arriving is independent of how many calls have already arrived. That is, there is no memory in the system; the probability of a new call arrival in a certain time interval depends only on the length of that time interval, and on nothing else. This is a reasonable assumption for a telephone exchange, since someone initiating a new call has no knowledge of or interest in how many people have also recently initiated a call.
More generally, a Poisson process is a random process in which new events can occur, in which we are interested in counting the number of events that have occurred, and in which the probability of a new event occurring is independent of how many events have already occurred.
Let the arrival rate be a number that we will denote by λ. (This is the Greek letter “lambda”. Greek letters are often used by mathematicians, simply because we would run out of available symbols if only the Latin alphabet were permitted.) Let the symbol Δt denote a short interval of time. Then we say that a random counting process is a Poisson process if the probability of a new event occurring during that short time is approximately equal to λΔt, with the approximation getting better and better as Δt becomes smaller.
Thus, in that very short interval, there is a probability λΔt that a new event will occur, and a probability (1 - λΔt) that no new event will occur. (And a negligible probability that more than one event will occur.) But what of intervals that are not infinitesimally small? How many events are likely to occur in a fixed time interval T?
(The next few paragraphs contain a mathematical derivation that some people will prefer to skip.)
Let p0(t) denote the probability that there have been no events from time 0 until time t. Obviously p0(0)=1. Slightly less obviously,
![]()
Where O(dt2) is a shorthand that refers to terms that will become negligible as dt becomes smaller. This can be rewritten as
which then leads to the differential equation
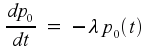
As it happens, this is a differential equation whose solution is well known. The solution is
![]()
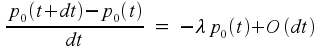
This is the equation for the probability that there have been no events in the time from zero up to t. Next, let pk(t) denote the probability that there have been exactly k events from time 0 until time t, where k>0. (Note that pk(0) must be zero.) The possible ways in which there have been k events from time 0 until time t+dt are:
there have been k events from time 0 until time t+dt, and then no events from t until t+dt;
there have been k-1 events from time 0 until time t+dt, and then one event from t until t+dt;
some other scenarios whose probability is negligible when dt is small.
This leads to the equation
![]()
and thence to the differential equation
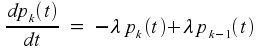
We already know the solution for p0(t), and thus we can solve this equation for the case k=1. Then, knowing that solution, we can solve for the case k=2, and so on for all k. The final result turns out to be
![]()
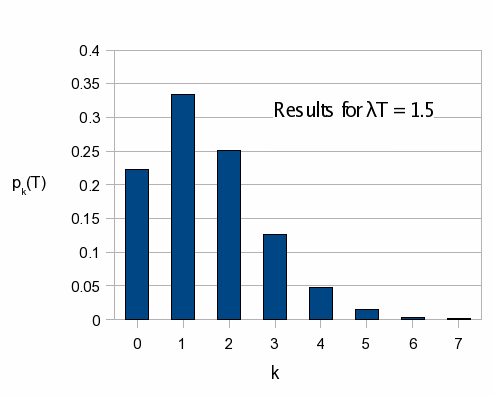
To get a feel for what these formulas mean, let us consider a case where the expected value is 1.5. The distribution of probabilities for this case is shown in the graph at left. The probabilities for the cases k=1 or k=2 are the highest, as expected, but there is still a non-negligible probability that no events will occur in this time. There is also a non-neglible probability that more than two events will occur.
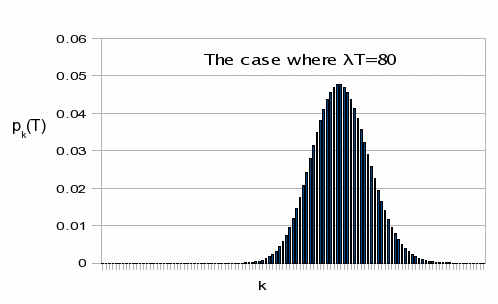 The
situation becomes more interesting when the expectation is larger.
Our next graph shows the situation where the expected number of
events is large: in the case that is illustrated, the expectation is
80. The probabilities are highest for a range of values centred about
k=80. What is more interesting, for those who are familiar with
probability distribution graphs, is the bell-shaped nature of the
curve. This is a consequence of something called the Central Limit
Theorem of probability theory. Very roughly speaking, this theorem
states that the graph will always be bell-shaped once the population
size gets large enough. (For those who want the more precise
statement, the Central Limit Theorem is really a statement about the
distribution of mean values of a random distribution. No matter what
the original distribution, the mean values will tend to have a
bell-shaped distribution.) This bell-shaped curve is called a
Gaussian distribution, named after another famous innovator whose
name was Gauss.
The
situation becomes more interesting when the expectation is larger.
Our next graph shows the situation where the expected number of
events is large: in the case that is illustrated, the expectation is
80. The probabilities are highest for a range of values centred about
k=80. What is more interesting, for those who are familiar with
probability distribution graphs, is the bell-shaped nature of the
curve. This is a consequence of something called the Central Limit
Theorem of probability theory. Very roughly speaking, this theorem
states that the graph will always be bell-shaped once the population
size gets large enough. (For those who want the more precise
statement, the Central Limit Theorem is really a statement about the
distribution of mean values of a random distribution. No matter what
the original distribution, the mean values will tend to have a
bell-shaped distribution.) This bell-shaped curve is called a
Gaussian distribution, named after another famous innovator whose
name was Gauss.
If you want an even more precise answer, it is “For large values of λT, the Poisson distribution is almost identical to a Gaussian distribution.”
So far, we have looked at situations that have a finite number of possible outcomes. It's actually more common to be faced with a continuum of possible outcomes.
Given a real number randomly chosen from the interval from 0.0 to 10.0, what is the probability that that number will be precisely equal to 4.7368? It might or might not surprise you to know that the answer is zero. There is an uncountably infinite number of real numbers in the stated interval. (Or, indeed, in any nonempty interval on the real line.) Thus, the probability that the answer is one given number is one divided by infinity, which is zero.
You might argue that, once the number has been chosen, it was clearly possible for that number to have been chosen. True, but the probability of choosing that number (before the choice was made) was still zero. This is a subtle distinction to be made between “with probability zero” and “impossible”. I'd rather not go into that detail, because it would require a digression into measure theory. I assure you, however, that those two terms don't mean the same thing.
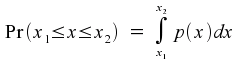
In any case, once you have an experimental situation where the result can be any real-valued number, the question “what is the probability that the result is equal to x?” is essentially meaningless, because the probability is zero. The more interesting question is “what is the probability that the result is between x1 and x2?”
For a random variable that can take on continuous rather than discrete values, the probability curve of interest is one that answers this question. For a real random-valued variable x, the probability density function p(x) is a function with the property that the area under the graph, from x1 to x2, is the probability that x lies between x1 and x2. The area in question is the shaded area in the following diagram.
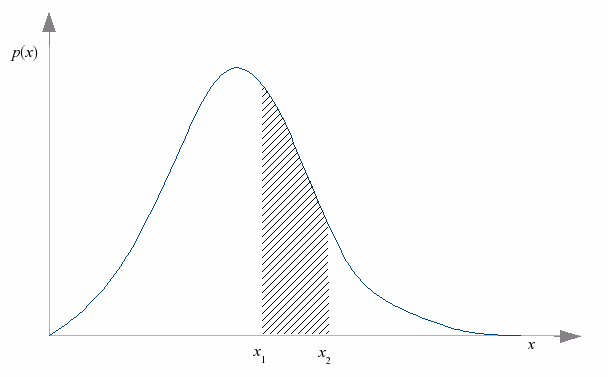
If you happen to be familiar with the notion of a mathematical integral, there is a more convenient way of expressing this. (And if you're not familiar with integrals, just think of an integral as being a notation for denoting the area under a curve.) The probability of x lying between x1 and x2 can be written down as
Notice that this necessarily means that
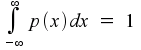
That is, the total area underneath a probability density curve must always be equal to 1. This is the same as saying that the random variable must take some value, with probability 1.
For those who are comfortable working with derivatives, the distribution function can be written as
![]()
These concepts, by the way, are not restricted to real variables. With the obvious changes to the formulae and the diagrams, we can also talk about the probability density function of a random variable that takes on values in (for example) a two-dimensional space.
Sometimes we need to talk about two (or more) random variables at the same time. To avoid getting too abstract, let us confine our attention to the case of two real-valued random variables x and y. The appropriate probability density function is now pxy(x,y), where the subscript is needed to show that we are talking about this particular density function, as distinct from, for example, the probability density function for x alone, which we could denote by px(x).
We can think of pxy(x,y) as being a function of two variables. Equally validly, we could think of it as being a function of the single variable (x,y), which takes values in a two-dimensional space. This latter interpretation might (or might not, depending on how your mind works) make it easier to understand that
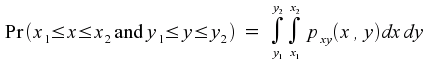
and
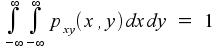
If you can imagine the three-dimensional picture where pxy(x,y) is the height of a curved surface above the two-dimensional (x,y) plane, then you can also imagine taking a slice through the curve that, for a fixed value of x, covers all possible values of y. If you think about what that slice really means, you should end up with the conclusion that
and, by orienting the slice differently,
That is, the joint probability distribution function carries within it, in the form of integrations across cross-sections, the probability distribution functions of the two variables separately.
Obviously, similar reasoning can be extended to cases involving three or more random variables.
If x and y are independent random variables, then measuring the value of one of the variables will give us no information about the other variable. A more common situation, though, is where the variables do have some correlation between them. Consider an example where
![]()
where n is a “noise” variable that can take on random values between -0.5 and +0.5. In this example, knowing the value of x does not tell us the precise value of y, but it does tell us more about y than if we didn't know the value of x. If, for example, we knew that x was equal to 3.2, then we would know that y was approximately equal to 9.6. In fact, we would know that the value of y was somewhere between 9.1 and 10.1.
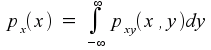
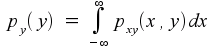
The notation Pr(A|B) means “the probability that A is true, given that we already know that B is true”. This is different from Pr(A), which means “the probability that A is true, given that we know nothing about B”. Likewise, when we are talking about probability density functions, p(x|y) is the probability density function for x, under the condition that we know the value of y. This is different from p(x), which is the probability density function for x when we know nothing about y. Because these two functions are in general different, we shouldn't give them the same name p; the usual convention is to write them as px|y(x|y) and px(x).
It is common to refer to Pr(A|B) as a “conditional probability”, on the grounds that it is a probability estimate for A that is conditional on knowing whether B is true. This is distinct from Pr(A), which is “unconditional” in the sense that it does not depend on any knowledge of B. This interpretation is, however, misleading. Pr(A) is an estimate of a probability based on what we know before information about B is available. If we know absolutely nothing, then the best we can do is to assume that all cases are equally likely. (Which is what we did in the coin-tossing and dice-throwing examples.) More commonly, we do have some initial information. That means that Pr(A) is really a shorthand for Pr(A|what we know before a measurement is made).
The important point to be understood here is that every probability is really a conditional probability, based on the information we have so far. When we write something like Pr(A), what we really mean is Pr(A|the information available to us so far). When you get right down to it, there is no such thing as an unconditional probability.
The same reasoning applies to probability density functions. The notation px(x) really means p(x|what we know so far).
“A priori” and “a posteriori” are Latin phrases that mean (approximately) “from the beginning” and “afterwards”. In probability theory, the first of these refers to the information we have before we have made any measurements, and the second refers to the information we have after taking a measurement.
By the same reasoning as in the previous section, there is no such thing as “the probability based on no initial information”. We always know something initially, even if that something is a statement that all possible outcomes are, as far as we know, equally probable.
The essential point here is that there is nothing special about a priori and a posteriori probabilities. They are both conditional probabilities, based on different information. In essence, the a priori probability of some assertion A being true is
Pr (A | what we knew before taking a measurement)
and the a posteriori probability is
Pr (A | what we know after taking the measurement)
You can skip this section if you're uncomfortable with mathematical derivations.
Two events or propositions A and B are said to be statistically independent if
Pr (A | B) = Pr (A)
That is, if knowledge about B does not add anything to our knowledge about A. Statistical independence means that we can multiply probabilities. That is, if A and B are independent, then
Pr (A and B) = Pr (A) Pr (B)
(You're going to have to take that assertion on faith, because at least for now I can't think of a simple but convincing explanation of why it is true.) It is important to note that this multiplication rule does not work without the independence condition.
We can make similar statements about probability density functions. Two real random variables x and y are statistically independent if
![]()
and, if we have this independence, then we have the multiplicative property
![]()
Now, if we have random variables x and y that are not necessarily statistically independent, it is still true that
![]()
because it doesn't add any new information to be told the value of y twice. That means that the conditional probability density for x|y is independent of y, even if x and y are not themselves independent. As a result, we get the multiplicative property
![]()
The same argument holds if we interchange the two variables, so it is also true that
![]()
As a result, we can conclude that
![]()
and finally
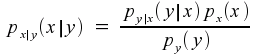
This last equation is known as Bayes' rule. It is helpful in computing conditional probabilities, and is valid whether or not the variables are statistically independent.
Let us now push the mathematics aside, and ask ourselves the question “what does a probability really mean?” Suppose that we shuffle a deck of cards, then randomly draw a card, look at the card, and discover that it is the three of hearts. What is the probability that the card was the three of hearts? Well, in fact, the probability is 1, which amounts to certainty. That's because we have already looked at the card.
If we repeat the experiment, but without looking at the card, the probability that the card was the three of hearts is 1/52. It seems, then, that the probability can change depending on whether we look at the card.
We can devise variations on this experiment. We could, for example, draw a card, show it to some other person, but not look at it ourselves. In this case, two different observers will give two different answers for the probability. Is this a contradiction?
No, it's not. This should be clear from what has been said about conditional probabilities. The probability depends on the amount of information we have, and different observers can have access to more or less information. A probability is not an inherent function of the thing being observed. The observer is also part of the system, and must be taken into account.
Indeed, it might be said that the observer is the most important part of the system, as far as computing probabilities is concerned. Ultimately, a probability density function is a measure of the observer's state of ignorance about the thing being observed. Give the observer more information, and the function will change.
You might or might not know the story of Schrödinger's cat. Schrödinger was a physicist who was concerned about some interpretations of quantum physics. In fact, he was the person who produced the equation that describes a particle (for example, an electron) in probabilistic terms. If you take Schrödinger's equation literally, an electron does not have a fixed position or momentum. Instead, it has a fuzzy existence as a sort of wave function that is spread over a region in space. At the time, the accepted interpretation – the so-called Copenhagen interpretation – of such fuzzy phenomena was that the fuzziness is an inherent property of the electron (or any other particle), rather than being merely a measure of the observer's state of ignorance.
As an argument against this interpretation, Schrödinger proposed a thought experiment. We can design a box where a poison can be released as a result of some unpredictable phenomenon, for example the emission of a particle from a radioactive substance. Let us put a cat inside the box, close the box, and leave it there for enough time that there is a 50% probability that the poison has been released. Then we can open the box, and see whether the cat is alive or dead.
Is the cat alive or dead before the box is opened? By a strict reading of the Copenhagen interpretation, the cat is neither alive nor dead, but is merely a wave function that expresses some probability of aliveness. When the observer opens the box, the wave function collapses to a simple true/false function that says either “the cat is alive” or “the cat is dead”.
That's from the viewpoint of someone who cannot see inside the box until it is opened. There is, however, another observer in the picture. If the cat is alive, the cat knows that it is alive even before the box is opened. That is, the wave function as observed by the cat is different from the wave function known to the person outside the box. (If there is any doubt as to the sentience of cats, we can repeat the experiment with a human inside the box.) The conclusion appears to be that the wave function is an observer effect rather than being a fundamental property of cats.
To be fair, it should be added that more has been learnt about quantum physics since Schrödinger's time. One thing that is now known is that the wave functions become less and less fuzzy as the object being described becomes larger. For a cat-sized object, there is very little fuzziness; the cat is big enough to maintain its own reality, and the observer has very little effect. For an electron-sized object, the jury is still out.
In fact, we can say more. A physical principle called Heisenberg's Uncertainty Principle says that we cannot measure the position of an object (or other properties such as momentum or kinetic energy) without disturbing it in some way, and therefore spoiling the accuracy of the measurement. If we shine a light at a cat, in order to see it more clearly, the light pressure will move the cat slightly, meaning that we can't precisely measure its position. For an object as big as a cat, the disturbance is so small that it can be neglected. For something as small as an electron, the effect is substantial.
The conclusion, then, is that it is fundamentally impossible to pin down the precise location of an electron. Is that because the electron is inherently a fuzzy entity with no well-defined position? Or is it because the electron does have a precise location, but that we're unable to measure it? The answer is that there's no way of telling. Either assumption leads to the same result.
When two physical theories give the same result in terms of what can be measured, we have to conclude that both theories are equally correct. There is no way to decide between them. In practice, all we can do is decide that one theory is “better” than the other on pragmatic grounds: that it leads to easier calculations, for example, or that it conforms better to human ways of thinking.
In questions like this, there is no such thing as truth; only convenience.
This article
by Peter
Moylan
Other
articles